
Introduction
New Relic Synthetic Monitoring (NRSM) is a cloud-based monitoring system. Maintaining a user-friendly experience in a highly competitive environment is quite essential for website managers. Thus the need for Synthetic Monitoring to ensure the smooth working of the site. You must have an idea that New Relic is a leading performance-monitoring (APM) application providing powerful features for analyzing and monitoring online applications.
Consider Synthetic Monitors as crash test dummies for your API, websites, and applications (Apps). A virtual browser tests your endpoints, runs through your workflows, and reports the results to the New Relic after proper deployment of synthetic monitors. If you still encounter any anomaly affecting your Apps, the synthetic Monitor will notify you of the problem in time.
What is New Relic?
The digital era is sufficed by the New Relic. It is the best software solution for your websites. Qnnit recommends reading the blog till the end to comprehend the complete knowledge about New Relic, Synthetic Monitoring, and Real Monitoring. New Relic is perfectly suited for businesses providing them with real-time insights into their online platforms.

New Relic is a cloud-based Application Performance Management (APM) solution offering the convenience of monitoring your website or application and its health. This way, you can diagnose the issues within time and implement solutions without much downtime. The health and performance of your apps are monitored in real-time.
You will be glad to know that New Relic supports a range of frameworks, platforms, programming languages, and cloud-based applications. Developers, DevOps teams, and IT Professionals love the software for its efficiency and effectiveness and for gaining actionable insights. It lets them improve IT operations and optimize any shortcomings.
It is significant to mention that you will observe consistent evolution in product offerings by New Relic. Hence, recommended to visit the New Relic official website and get to know about its latest features and functions. This is one of the best platforms that you can deploy to make your life convenient and boom your business. The best part is that it is also user-friendly, and with just a little training, you can easily learn to operate the software.
Synthetic Monitoring offers:
What is Synthetic Monitoring?
Synthetic Monitoring is a process of forecasting when a service or system might fail. This is done with the help of monitoring the platform and diagnosing its issues within time while avoiding catastrophic failure. You may understand it as a way of centralized services to check the performance, such as application errors and JVM restarts.

Synthetic Monitoring is also called “Active Monitoring” or “Synthetic Testing”. It analyzes the availability and performance of websites, Apps, or any other digital platform. You will be amazed to know that the process involves the simulation of user interactions and requests to monitor the system’s response per scripted conditions.
What happens is that Synthetic Monitoring creates artificial transactions mimicking the actions of a real-life user. These actions may involve form filling, button clicks, visiting web pages, and carrying out API Calls. These artificial tasks are performed at intervals through several locations and devices. Consequently, insights are collected about the performance and availability of the designated platform.
Real-User Monitoring
Real User Monitoring, or also called short form as “RUM,” is a passive monitoring technique to analyze user interactions on an online platform. Client interaction is analyzed with the help of a cloud-based App or a server. It is of utmost importance to observe the user interactions on a website or application and determine if the services from the platform are delivered satisfactorily.
RUM identifies platform shortcomings in an instance while offering you an opportunity to correct the error without much inconvenience to the users. The essence of this system is that there are no simulations, and everything happens in the real world, providing you a chance to observe and understand the behavior and needs of a real-time user while optimizing your services and your platform.
Synthetic Monitors for Proactive Monitoring
You cannot simply consider synthetic monitors as Ping monitors. In fact, they are much more than that. Synthetics can perform scriptable checks on applications, even down to the HTTP headers. 21st century has brought you this amazing opportunity to browser monitoring with selenium-driven scripted browsers allowing you to test business transactions, login procedures, and searches.
Website developers can now easily run API tests to verify certificates or check if any type of HTTP request is accomplished. Additional Node Modules offer extended use case coverage for your scripted API monitors. Users can conveniently detect an error from the AIWS location, network, or third-party resource.
Difference between Synthetic Monitoring & Real-User Monitoring
Synthetic Monitoring allows you to acquire the context of failures by connecting the endpoints of performance and availability to the infrastructure and applications. Whereas, Real user Monitoring passively monitors and analyzes all user interactions with a cloud-based client interacting.
We have compiled a table highlighting the difference between Synthetic Monitoring vs. Real-User Monitoring:
Synthetic Monitoring | Real Monitoring | |
Monitor APIs | X | |
Determine the impact of errors or failures. | X | |
Ensure smooth running of the App. | X | |
Test a new location/geography. | X | |
Resolve support issues | X | |
Monitor real users/all traffic. | X | |
API performance | X | |
SLAs | X | X |
Test a new feature before deployment. | X | |
Determine the main cause of errors in the application. | X | |
Transaction performance | X | X |
Some more differences between Synthetic and Real-User Monitoring are mentioned here to elaborate the concept further:
Parameters | Real-User Monitoring | Synthetic Monitoring |
Off-Peak Monitoring | Limited Availability | Off-peak Monitoring |
Condition | Real-User Condition | Browser & Network condition |
Monitoring Type | Availability in Off-peak hours | Monitors entire system |
Implementation | Own website | On any website |
Detection | After user-impact | Proactive detection |
JavaScript | Required | Not required |
Root Cause | Does not identify | Identifies |
Benchmarking | No ideal | Ideal |
Types of Synthetic Monitoring
There are different types of Synthetic Monitoring. Each one is designed and developed to keep an eye on a certain service area. Here are those:
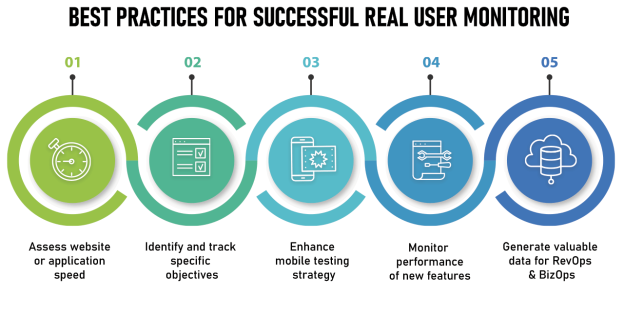
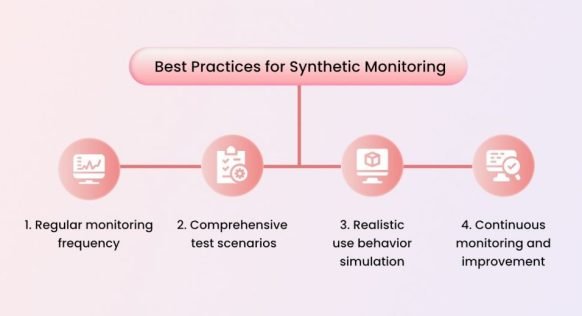
Best Practices for Synthetic Monitoring
Businesses around the world need to implement best practices of Synthetic Monitoring to help them achieve goals, such as:
Top Synthetic Monitoring Tools
Here are the most demanded Synthetic Monitoring Tools:
Types of Synthetic Monitors
Website developers and managers have this fantastic tool to monitor the activities and performance of your website with synthetic monitors. One of the best features, “host not reporting,” offers infrastructure monitoring. Avail the opportunity of advanced Monitoring and run your platform smoothly.
You are offered:
The good news is that seven types of synthetic monitors could assist you in keeping your website running smoothly:
Types of Synthetic Monitors | Description |
Certificate Check Monitor API Name: SCRIPT_API | Proactively pings your domain certificates based on a configurable threshold. |
Broken Links Monitor API Name: SCRIPT_API | Tests all the links on the page and provide a URL. |
Step Monitor API Name: STEP_MONITOR | Advanced monitors and needs no code to set up. |
Ping Monitor API Name: SIMPLE | The simplest type of Monitor to check the online status of an application. |
Scripted Browser Monitors API Name: SCRIPT_BROWSER | Used for sophisticated and customized Monitoring. |
API Tests API Name: SCRIPT_API | Used to monitor API endpoints |
Simple Browser Monitors API Name: BROWSER | These are pre-built scripted browser monitors making a request to your website through Google Chrome. |
Synthetic Monitoring Features
Several salient features are mentioned here to give an overview of the effectiveness:
Features | Description |
Detailed Results | A 13–month record is stored for every run on your website to have a view a detailed breakdown of every check. |
Real Browsers | Synthetic Browsing checks your host with the help of a Scripted and Simple browser. |
Device Emulation | Used to simulate handheld devices in scripted and simple browser monitors. |
Comparative Charts with Browser Monitoring | A “Comparative Charting” feature of New Relic allows for a direct comparison of page load time between synthetic monitors and real user interactions. |
Compatibility with Popular Analytics Platform | It excludes scripts for analytics services such as Google Analytics. |
Advanced Scripted Monitoring | Scripted Browsers are utilized to run complex test cases for your website. |
REST API Functions | Synthetic Monitoring is used to manage alert notifications, simple & scripted monitors, categories, and labels for monitors. |
Global Test Coverage | Locations could be checked globally to ensure website accessibility for users. |
Synthetic Monitoring Benefits for Global Businesses
Global businesses are known to benefit from synthetic Monitoring to ensure the optimal performance of their digital platform services.

Some of their useful effects are mentioned here:
Benefits | Description |
Benchmarking & SLA Monitoring | Businesses can set certain performance benchmarks or APIs for third-party services and then monitors compliance with agreements with the help of synthetic Monitoring. |
Global Performance Monitoring | Global companies can test their Apps’ performance from anywhere in the world to offer a smooth user experience. |
Regulatory Compliance | Companies are enabled to improve user experience with Synthetic Monitoring. This is beneficial because regional data privacy matters may negatively affect the Availability and performance of the platform. |
Complex Application Monitoring | Synthetic Monitoring simulates processes in several applications, imitates actions, and tests API performance and user interactions to test how things work. |
Performance Optimization | Bottlenecks, problematic third-party integrations, and slow-loading elements are found with the help of Synthetic Monitoring for App optimization. |
Business Agility | You can deploy Apps with the help of Synthetic Monitoring while keeping in mind the changing scenarios of your business. |
Predictive Nature | You can gauge and analyze operational data with the help of Synthetic Monitoring to forecast the later performance of your website, App, or any other online platform. |
Types of New Relic Synthetic Monitoring
New Relic Synthetic Monitoring is a purpose-built tool to simulate real-like user interactions with online platforms such as Apps and websites. If the software finds any kind of issue, then you are immediately notified about the anomalies or errors. Then you may correct them and avoid any bad experience by the user in advance.
You may also consider it a virtual detector continuously looking for potential errors in your Apps or websites. It is quite a clever tool for synthetically identifying the potential threats in your system after running different tests. These tests are a close copy of a real-life user. The best part is that you receive global insights for a timely website or App optimization.
New Relic offers you seven types of Monitoring:
If you want to set up Monitoring Page load Performance and Availability (Ping), then follow these steps:
Choose a Synthetic Monitor
Summary Page
Results by the Monitor
Comprehend the Resource Load-Time
How to Get Synthetics Monitoring to Work Properly in New Relic?
All you have to do is follow these simple steps to set up Synthetics Monitoring in New Relic:
Remember that specific steps may differ a little bit depending on the version of New Relic Software.
How to Configure the New Relic Synthetic Monitoring
We got sufficient information regarding how to set Up Monitoring Page load Performance and Availability (Ping) in the above sections. All you have to do is utilize the simple Browser Monitor to check the performance and availability of one page and also observe the page load speed.
Now, let`s head to how to Configure the New Relic Synthetic Monitoring with a step-by-step guide:
Step1: Choose a Synthetic Monitor

Step 2: Set up Page Load Performance Monitor

Step 3: Choose the Location for the Page Load Performance Monitor

Step 4: Check the Page Load Performance Test Results

You are also allowed to check the loading times of several pages of the website.

You will be notified that users from a certain location need help loading the page. The longest load time is around 3.2 seconds.

You will be given information about how much time every component takes to load, such as Text, HTML, CSS, Images, and JS. All you have to do is tap on any component, and the result will be displayed.

You can even check the components’ details, such as status, size, server IP, connection ID request time, HTTP version, and much more. All that is possible with just a few clicks.
New Relic Pros
Here are the pros of New Relic:
Pros | Description |
Application Performance Monitoring (APM) | The APM capabilities are offered by New Relic, enabling the entities to keep a close eye on your applications or websites. The collected data contains database queries, response times, and server resources. |
Synthetic Monitoring | The best part is that New Relic allows businesses to simulate real-life user interaction while analyzing the performance of applications and websites. |
Infrastructure Monitoring | New Relic offers Monitoring of infrastructure to acquire performance checks on virtual machines, cloud environments, network traffic, and infrastructure metrics. |
Dashboard & Reporting | The New Relic provides a customizable dashboard along with reporting features with the benefits of analyzing and visualizing the Monitoring Data. Moreover, graphs, charts, alters, and performance metrics are also part of the provided package. |
Real User Monitoring | The RUM of New Relic offers a complete analysis of actual user data such as their interactions with the application or website. |
Error Monitoring | The error monitoring capabilities of the New Relic allow tracking and analyzing the errors in the applications. A comprehensive report is provided regarding error rates and affected users. |
Synthetic Monitoring Pros
Here are the pros of Synthetic Monitoring:
Pros | Description |
Availability Monitoring | Synthetic Monitoring analyzes the availability of websites or applications by carrying out predefined scripts with intervals. Errors are promptly detected and notified at once. |
Troubleshooting & Diagnostics | The best part of Synthetic Monitoring is that it can diagnose performance issues and provide a detailed report. Here all the concerns, server errors, problematic third-party integrations, and database queries are pinpointed for timely actions. |
Geographic Coverage | Synthetic Monitoring will allow you to simulate user interactions from several networks or locations. This will help identify latency issues, content problems, and regional performance variations. |
Proactive Monitoring | Synthetic Monitoring allows proactive Monitoring by carrying out regular checks at predefined schedules. You will be able to detect and timely address the issues with the least inconvenience. |
Performance Measurement | Synthetic Monitoring will enable you to gauge the performance metrics, transaction times, load times, response times, and resource utilization. |
Service Level Agreement (SLA) Compliance and Benchmarking | You can use Synthetic Monitoring to place benchmarks for the performance of Apps or websites while tracking SLA compliance. |
Website and application developers must take the help of tools such as Uptime Robot, New Relic Synthetics, and Pingdom to stay ahead of the game while beating the competition.
Is New Relic Synthetic Monitoring a Secure Way of Monitoring Websites or Applications?
The New Relic Synthetic Monitoring (NRSM) is completely safe and secure for monitoring your websites and applications. The system is purpose-built to protect your online platforms from potential threats. It utilizes the latest encryption standards, secure credential storage, and private monitoring capabilities to keep your data safe and sound.
Here are some key features to give you an idea of how secure the NRSM is:
Frequently Asked Questions (FAQs)
Following are the FAQS about synthetic Monitoring:
Q1: What is Synthetic Monitoring?
Ans. Synthetic Monitoring is an effective software designed and developed to monitor the performance and health of your websites or applications.
Q2: What is the Synthetic New Relic?
Ans. Synthetic New Relic expands the Monitoring of your browser with selenium-powered scripted browsers to test login procedures, critical business transactions, and searches.
Q3: What is New Relic Synthetic Monitoring?
Ans. New Relic Synthetic Monitoring allows for proactive Monitoring for your online platforms and implements necessary measures.
Q4: What is new relic synthetics pricing?
Ans. The Data Plus option is priced at $0.5/GB per month while including extended data retention and advanced data governance. The additional price is charged at $0.005 per check.
Q5: What are new relic synthetics checks?
Ans. Synthetic Monitoring is a comprehensive solution for automated checks on the New Relic for monitoring applications, websites, API endpoints, and business transactions.
Q6: How to get synthetics monitoring to work in a new relic?
Ans. Follow these steps:
Q7: Is it possible to Monitor API endpoints with Synthetics?
Ans. Yes, Synthetics completely supports API tests to check the response time and Availability of API endpoints.
Q8: Is it possible to Monitor the performance of a website from different locations?
Ans. Yes, Synthetics supports you in choosing different geographical locations from where checks will be executed.
Conclusion
New Relic Synthetic Monitoring is the need for fast digital space to monitor the performance of your applications and websites. The tool is necessary for proactive performance management. We have made a significant effort to provide you with a detailed guide on NRSM. The insights gained from the Synthetic Monitoring are of great importance to your platform up and running smoothly.
Qnnit is proud to offer you complete knowledge of synthetic Monitoring and how significant the software is for your website or App. Keep visiting our website at Qnnit.com for more such information and guides. We cover the latest IT–related topics. Please, let us know what you think about Synthetic Monitoring and its future prospects.